Conversions
Overview
The Conversion Report helps businesses better understand top Lead Sources, Programs and Campaigns driving their website traffic. Pumping money into marketing, such as trade shows, pay per click advertising, SEO and more drives people to the front door of your business, your website. That's half the battle. What happens once they get there? How do you know which primary marketing channels and campaigns are driving website activity and which channels yield the highest conversions?
Lead Liaison's in-depth tracking engine watches Prospects as they flow through the funnel from visitor to customer. As visitors convert through each key stage Lead Liaison calculates conversion percentages for Lead Sources, Programs and Campaigns and identifies which Prospects progress through the funnel. These stats are packaged up into our Conversion Report, which is explained in more detail below.
Accessing the Conversion Report
To access the Conversions report go to Reports > Conversions. Under the Conversions folder you'll find three reports, Lead Source, Program and Campaign. Each report looks at data for specified Lead Sources, Programs or Campaigns.
Definitions
- Lead Sources:
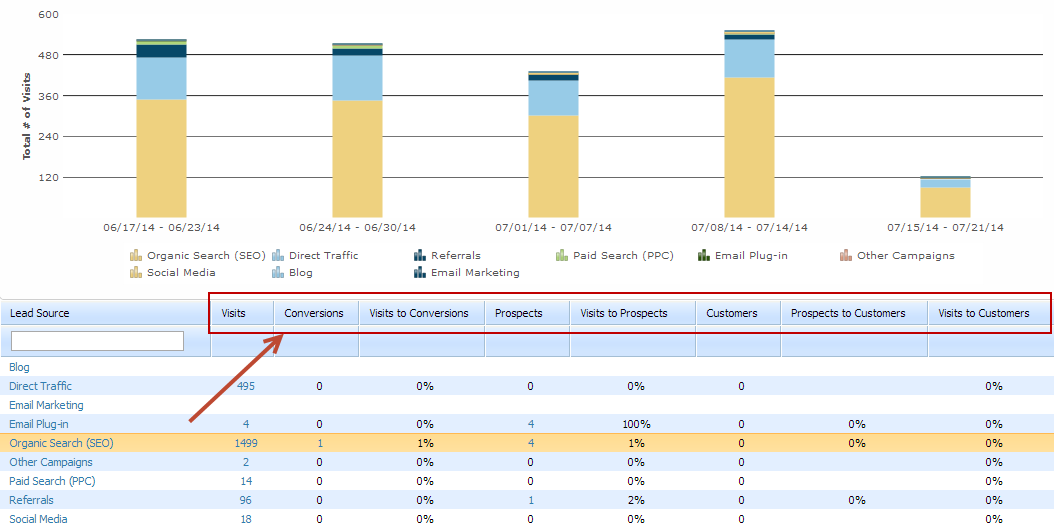
- Visits: Total unique visits from this Lead Source during the date range. Note that visits are different from visitors or page views.
- Conversions: Total number of Visits from this Lead Source that were converted to Known Prospects (identifiable people, by email address). For each Lead Source, we calculate the number of Anonymous Prospects who were converted to Known Prospects within the selected date range. Conversions do not include Known Prospects imported into the system from a CRM or CSV file.
- Visits to Conversions: Shows the percentage of Visits to Conversions within the selected date range who have this Lead Source. Calculated as [# of Conversions] / [# of Visits].
- Prospects: Total number of Known Prospects created in your account during the selected period with this Lead Source. Known Prospects could either be from converted visits, uploaded contacts, or imported contacts from your CRM into Lead Liaison during the specified period. For each Lead Source, we calculate the # of known Prospects whose create date is within the selected day.
- Visits to Prospects: Shows what percentage of Visits were converted to Prospects during the selected period of time. Calculated as [# of Prospects] / [# of Visits], which is the number of created Known Prospects (including imported/uploaded Prospects and Prospects converted from Anonymous to Known).
- Customers: Number of people having this Lead Source that became customers during the specified period. Customers are Prospects linked to a closed-won opportunity that was closed during the selected period of time. The method of Revenue Attribution is different from standard ROI calculations in this model. The contact does not need to be a primary contact assigned to the opportunity. A "Customer" is any contact who is a member of a closed won opportunity.
- Prospects to Customers: Shows the percentage of Prospects converted to Customers having this Lead Source during the selected date range.
- Visits to Customers: The percentage of Visits that became Customers during this time frame.
- Campaign/Programs:
- Use the same descriptions above but change out "Lead Source" with "First Touch Campaign" and "First Touch Program".
- The chart will show the top 10 Programs/Campaigns by default. If there are more than 10 Programs/Campaigns they will be grouped together under "Others".
- Program and Campaign data uses the First Touch Program and Campaign.
Choosing New Values for Lead Source
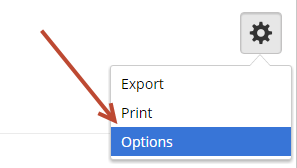
- To add/remove Lead Source values from the chart and grid click the gear icon and choose Options. Note, the gear is not visible from the Programs and Campaigns Conversion report.
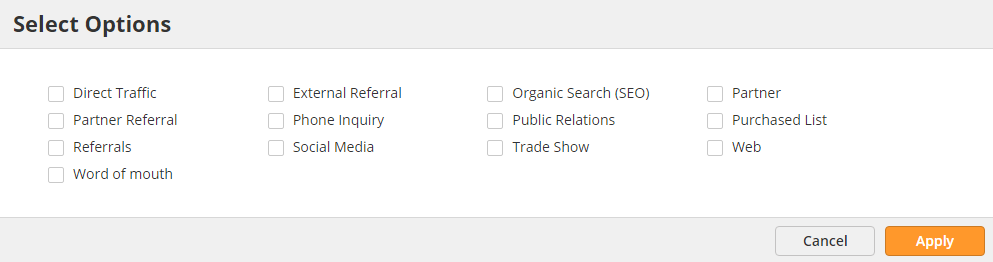
- When the popup appears select/deselect new values as shown below. By default, the popup will load standard Lead Sources as well as your top 10 First Touch Programs and First Touch Campaigns. This view cannot be saved, so make sure to choose your values and export your data as needed.
Choosing New Date Ranges and Changing Report Type
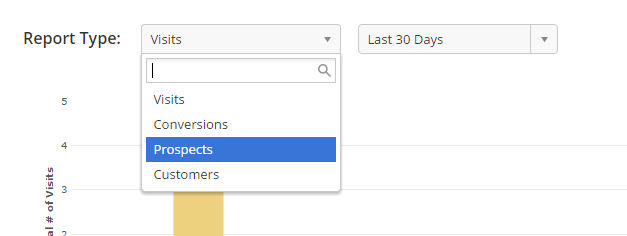
To change the date range select the date drop down and choose your values, including a custom date range. To change the graph view select the Report Type drop down and choose from Visits, Conversions, Prospects or Customers.
Digging Deeper
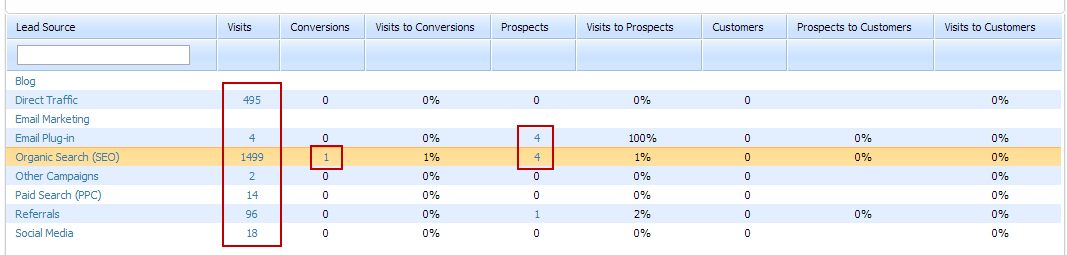
To identify the businesses and people categorized into each area click any number that's hyperlinked, as shown in the screenshot below. This will take you to the Memberships Page. In the example below, clicking any value under the Visits column will show the visitors who have this Lead Source during the specified date range.
Example Results
- Visits => Visits 100
- Conversions => Converted Prospects 20
- Visits to Conversions => Converted Prospects 20%
- Prospects => Prospects 35
- Visits to Prospects => Visits to Prospects 35%
- Customers => Customers 14
- Prospects to Customers => Prospects to Customers 40%
- Visits to Customers => Visits to Customers 14%
Notes
- Statistics are calculated daily.
Data snaphsots:
The conversions engine takes daily statistic snapshots to ensure data is preserved on a day-to-day basis. For example, assume that on July 1st there were 500 Prospects with a First Touch Campaign called "Campaign A". Then, on July 10th, a user manually removed 100 of these Prospects from Campaign A. The 500 Prospects calculated on July 1st will not change since the snapshot preserved these values.
- The same applies for calculations on Visits. If on July 1st there were 100 visits with a Lead Source as "Social Media", then on July 10th ten of these Prospect's Lead Status were changed to something else and five of the Prospects were deleted, this will not affect the previously calculated value of 100.
- However, when clicking through the numbers in the grid (any number highlighted as a link) you'll be taken to the memberships page where real-time data matching the selected criteria is shown. In example #2a above for Campaign A, if the user clicked the value of 500 it will take them to the memberships page and could only show 400 Prospects, which match the existing criteria, since 100 of them were removed manually.
Chart display: The graph will show values daily, weekly or monthly depending on the date range selected.
Daily: If date range is less than or equal 2 weeks- Weekly: If the date range is less than or equal to 1 month
- Monthly: If the date range is more than 1 month
![]()
© 2021 Lead Liaison, LLC. All rights reserved.
13101 Preston Road Ste 110 – 159 Dallas, TX 75240 | T 888.895.3237 | F 630.566.8107 www.leadliaison.com | Privacy Policy