Hot Prospects
Usage Notes
- For Salesforce.com users there is a separate AppExchange plug-in called "Lead Liaison Briefcase".
- Briefcase shows data for Known Prospects only.
Overview
Lead Liaison's Hot Prospects dashboard provides unparalleled lead qualification capabilities for businesses. Salespeople often times complain about "leads" coming from marketing teams. Sales tells marketing they are not leads, rather, they are contacts. Salespeople have a reason to make this claim; 80% of marketers pass unqualified leads to sales. To make matters worse, 80% of leads marked "unqualified" will make a purchase within 18 months. It's imperative businesses qualify their leads. Marketing can helps sales by using automated technology. Lead Liaison provides various lead qualification methods to solve this problem such as lead scoring, lead grading, buy signals, recency and total activity to calculate one value, priority. Now, salespeople have a dashboard for their prospects. Instead of sifting through a massive database with no sense of priority, they now have a single view for who's hot and who's not. Sales effectiveness has reached new heights.

Location
- Hot Prospects settings are located under Settings > App Setup > Lead Qualification > Hot Prospects
- Sales and/or marketers can view prospects by going to Prospects > Hot Prospects
Features
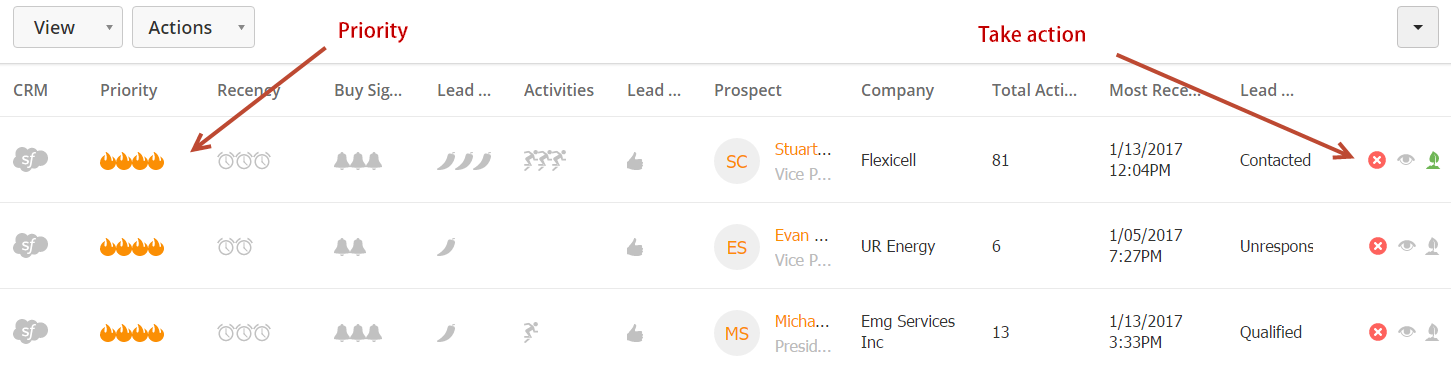
Default View
Hot Prospects are sorted by Priority by default. Priority measures the number of items in the customer's dashboard for a given prospect.
Weights
Each parameter in the dashboard has a Weight value. A Weight value multiplies the calculated value by the the value of the Weight. For example, if there are 3 clocks for Recency and the Weight value is "x3" then the number of points attributed to the Priority value would be 9 (3 clocks x 3 for Weight).
Here are a few additional examples of calculating Priority with Weights:
- Recency has 3 clocks with x1 Weight, Buy Signals has 3 bells with x2 Weight and Lead Score has 2 peppers with x3 Weight. Total = (3 x 1) + (3 x 2) + (2 x 3) = 15. With a total of 15 points 4 flames would be shown since the point value of 15 is greater than 12 (assuming the default setting for 4 flames)
- Recency has 1 clock with x4 Weight, Total Activity has 2 runners with x1 Weight. Total = (1 x 4) + (2 x 1) = 6. With a total of 6 points 2 flames would be visible.
Weight Range
- Weights range from x1 to x5.
- Weight values can be changed anytime. Prospects in the dashboard will be updated in real-time once the new Weight settings are changed.
Settings
Here's an explanation of what each lead qualification parameter does.
Value | Purpose | Rules | Icon | Example |
|---|---|---|---|---|
Priority | Measures the hottest prospects based on a formula calculated from Recency, Buy Signals, Lead Score, Total Activities and Lead Grade. Priority values can be changed anytime. Prospects will be updated in real-time when the priority ranges are changed. It's recommended to tune priority ranges over time to get the most out of the dashboard. |
| Flame |
|
Recency | Measures inbound activity. The more recent the inbound activity the higher the ranking received. |
| Clock |
|
Buy Signals | Measures buy signals. The more recent the Buy Signal the higher the ranking received. |
| Bells |
|
Lead Score | Measures lead score. This value is based on your lead score Cold, Warm and Hot settings under Settings > App Setup > Lead Qualification > Lead Scoring > Categories. |
| Pepper |
|
Activities | Measures inbound activity. Examples of inbound activity are email opens, website visits, document downloads, video watches, etc. This does not include outbound activity (sending an email). |
| Runner |
|
Lead Grade | Determines if the lead fits a customer's ideal buyer persona. |
| Thumbs Up |
|


User Interface Columns
- CRM
- For companies that have a CRM, such as Salesforce.com, connected to Lead Liaison a CRM column is shown. If the prospect is synced to the companies Salesforce.com account (matching based on email address) then the CRM logo is shown. Clicking the CRM logo will open the lead/contact detail page for the prospect in a new tab.
- Priority
- One simple way to calculate who's hot and who's not. Priority is calculated from various lead qualification parameters.
- Recency
- Measures inbound activity. The more recent the inbound activity the higher the ranking received. For example, if a prospect made a web visit within the past week that might yield three clocks (depending on settings).
- Buy Signals
- Measures buy signals. The more recent the Buy Signal the higher the ranking received.
- Lead Score
- Measures lead score. This value is based on your lead score Cold, Warm and Hot settings under Settings > App Setup > Lead Qualification > Lead Scoring > Categories.
- Activities column
- Shows the Total Activities number for a prospect.
- Lead Grade
- Determines if the lead fits a customer's ideal buyer persona.
- Prospect
- Name of the prospect. Clicking on this value takes the user to the prospect profile page.
- Company
- Name of the company the prospect works for. Clicking on this value brings up the company detail page showing revenue, description, industry, location, overview and more for the account.
- Total Activities
- The numerical value of Total Activities.
- Lead Status column
- Shows the Lead Status value of a prospect. This column is only visible for companies that have a CRM connected to Lead Liaison.
Watch, Ignore and Nurture
- Watch
- Clicking this icon brings up a popup to add the prospect or company as the user's favorite. This is the same functionality as the popup in the Visitors page.
- A colored version of an eye is shown if the individual and/or company is already in the user's favorites.
- A black and white version of the eye is shown if the individual and/or company is not in the user's favorites.
- Ignore
- Clicking this removes the prospect from the users dashboard (not the company's dashboard). When they are removed they will not be visible in the dashboard. This simply removes the prospect from this view by hiding them.
- Click the red/silver x icon to hide the prospect from view.
- When the icon is clicked the prospect is hidden from the dashboard and cannot be viewed in future visits.
- Nurture
- Clicking this icon brings up a popup to add the prospect to an automation.
- A color version of a green plant is shown when the prospect is already part of an automation.
- A black and white version of a plant is shown when the prospect is not part of an automation.
Changing Views
The dashboard has multiple "Views" which is handy for individuals with different roles in an organization. For example, a salesperson might use the Visitors and My Favorites View whereas a VP of Sales (managing an entire sales team) might use the My Company view. Each View is described below. To change your View click the drop down next to "View".
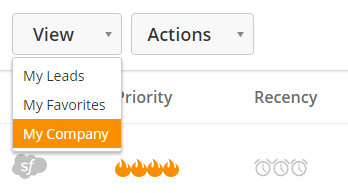
- Views
- My Leads = Only displays prospects where the user is the Lead Owner.
- My Favorites = Only displays prospects that are marked as a Favorite and have the Lead Owner as the user.
- My Company = Shows all prospects for your company.
- Hot Prospects vs. Active Accounts (*coming)
- Hot Prospects shows prospects.
- Active Accounts shows only accounts sorted by Inbound Activity.
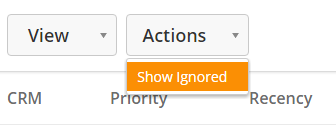
Showing Ignored Prospects
Once Prospects are ignored they can be un-ignored by clicking the gray X icon. By default, prospects are hidden from your View once they are ignored. To display ignored prospects within your View check the "Show Ignored" check box as seen in the screenshot below.
Operational Specifics
The dashboard processes updates to the following criteria nightly: Priority, Recency, Buy Signals, Lead Score, Activities and Lead Grade (flames, clocks, bells, peppers, running man and thumbs up respectively). All other criteria such as Prospect name, Company, Total Activities, and Lead Status are updated in real-time.
- Dashboard processing runs at 5:03AM Central US time.
- Dashboard processing runs once daily.
- The dashboard processes up to 500 records per category (score, grade, recency, activities and buy signals), with 2,500 maximum.
![]()
© 2021 Lead Liaison, LLC. All rights reserved.
13101 Preston Road Ste 110 – 159 Dallas, TX 75240 | T 888.895.3237 | F 630.566.8107 www.leadliaison.com | Privacy Policy