Stats
Statistics provides valuable information on the performance of your automation.
Effectivity and Completeness
High level statistics are available on the Automations page, such as effectivity and completeness, as described below:
- Completed = The percentage of people who have completed this automation. For example, if the automation has 100 Prospects, and 57 of them have had all actions applied, then the value here would be 57%. This value is only shown if the automation has run at least one time and is not in draft mode.
- Effectivity = How your automation is performing against industry standards. Stars are based on taking the % of the Automation Click-through-rate divided by the industry standard click-through rate. For example, suppose your industry is "Software and Web App", with an industry average of 2.44%. If one of your automations has a click through rate of 1.89%, then the Effectiveness rating is 1.89/2.44 = 77%, which would get 4 stars. Notice the 1 star range is 30% (not 20%). Industry standard click-through rates are listed at the bottom of this page.
- 0%, no stars
- > 0% and < 30% 1 star
- >= 30% and < 50% 2 stars
- >= 50% and < 70% 3 stars
- >= 70% and < 90% 4 stars
- >= 90% 5 stars
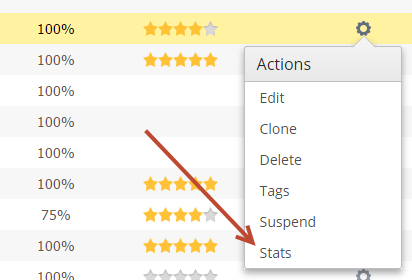
Stats Page
To view automation stats do the following:
- Click Automation on the left-hand menu
- Under the Actions column, click Stats
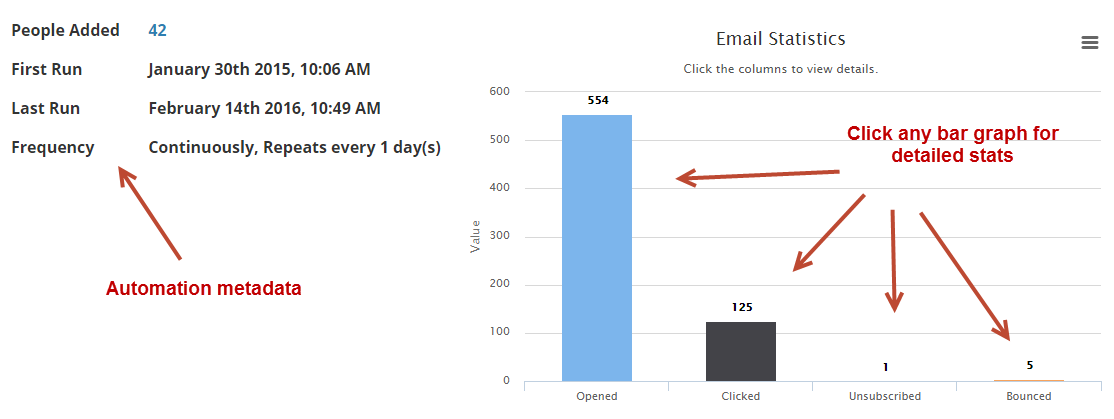
Metadata
The stats page shows opens, clicks, unsubscribes, and bounces in a graphical view on the right when at least one Send Email action is in the automation. On the left, key runtime data is provided. Each metric is described below:
- People Added = The number of Prospects added into the automation.
- First Run = The first time the automation ran.
- Last Run = The last time the automation ran.
- Frequency = How often the automation runs.
- Opened = Total number of unique email opens. Unique is defined per Prospect per email. For example, if the same Prospect opens two different emails this would count as two unique opens.
- Clicked = Total number of clicked links. These are not unique, every link click counts, even multiple clicks by the same Prospect.
- Unsubscribed = Total number of Prospects who have unsubscribed.
- Bounced = Total number of bounced emails.
Email Activity Details
When hovering over any column the chart will also show a percentage value. This value is determined by taking the chart value and dividing it by the total number of emails sent by the automation. In the example below, this value indicates 23.5% of all emails sent from this automation were opened.
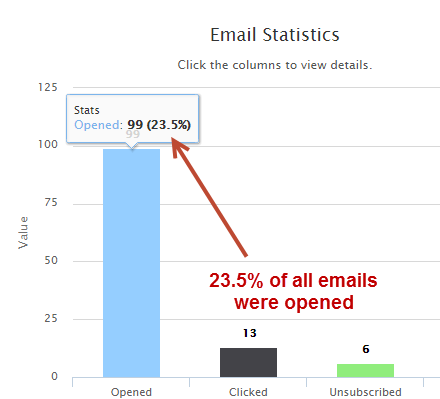
Clicking any column shows detailed stats in the tables below.
Deleted/Removed Prospects
If Prospects are deleted from an automation or an associated list then they will not be shown in the detailed table view; however, their activity (opens, clicks, etc.) will still be shown in the graphical data.
Opened = Shows all Prospects who have opened this email campaign (email address) and the “Date & Time” of the open activity. All values are shown, not only the unique opens. If the same Prospect opens an email multiple times, then this will show multiple times in the grid. Date and time is in the user's timezone.
Clicked = Shows all link clicks, even multiple clicks by the same Prospect.
Unsubscribed = Shows all Prospects who have unsubscribed.
- Bounced = Shows all Prospects who have bounced.
Automation Actions
The Automation Actions section helps identify where Prospects are in the overall flow of the automation. Each column is explained below:
- Action = The name of the specific automation action.
- Order = The order of the action in the automation.
- In stage = Number of people at this stage/action right now. In other words, this action is the next action to be applied on the Prospect.
- Pending = Number of people this action is scheduled to run on, but did not run yet. This value includes people in stage as well as not in stage.
- Applied = Number of people this action has run on and was applied to.
- Skipped = Number of times this action has run on a person but was skipped.
- Details = Shows the details of this specific action. At the moment, only the “Send Email” action will have any details, which are:
Starting from February 7th, 2016
Stats are collected after February 7th, 2016 for all Send Email actions. Data is not available prior to this date.
- Sent = Total number of emails sent by this specific action.
- Opened = Total number of unique email opens triggered from this action. If the same Prospect opens the same email multiple times then it counts as one unique open.
- Clicked = Total number of email link clicks in emails sent from this specific action. All clicks, including multiple clicks from the same Prospect within the same email, will count.
- Unsubscribed = Total number of unsubscribes from people clicking the unsubscribe link in an email sent from this action.
- Bounced = Total number of bounces from emails sent from this specific action
Notes:
- The “Opens”, “Clicks”, “Unsubscribes”, and “Bounces” values under the Details column are clickable. When clicked a grid at the bottom is displayed with activities for emails sent from this specific action. For example, if the user clicks the “Opens” icon, then we'll filter the “Unique Email Opens (Initial Open)” grid by all people who have opened an email sent from this specific action.
- For the “Send Email” action, if the default condition has a selected email campaign, we show the name of the email campaign in this format: [Send Email:] [Email Campaign Name]
- For the Order, In Stage, Pending, Applied or Skipped columns, all the values shown are for all people within the automation, both known and unknown.
Email Benchmarks (Industry Standard Email Stats)
| Industry | Open | Click | Unsub |
| Agriculture and Food Services | 25.18% | 3.23% | 0.28% |
| Architecture and Construction | 25.10% | 3.00% | 0.36% |
| Arts and Artists | 27.46% | 2.88% | 0.27% |
| Beauty and Personal Care | 19.02% | 2.15% | 0.33% |
| Business and Finance | 21.43% | 2.76% | 0.24% |
| Computers and Electronics | 21.30% | 2.36% | 0.30% |
| Construction | 22.56% | 1.98% | 0.44% |
| Consulting | 19.59% | 2.41% | 0.28% |
| Creative Services/Agency | 22.67% | 2.77% | 0.36% |
| Daily Deals/E-Coupons | 13.73% | 1.84% | 0.10% |
| eCommerce | 16.80% | 2.50% | 0.22% |
| Education and Training | 21.98% | 2.79% | 0.20% |
| Entertainment and Events | 21.50% | 2.39% | 0.27% |
| Gambling | 16.56% | 3.02% | 0.15% |
| Games | 21.60% | 3.27% | 0.23% |
| Government | 26.39% | 3.64% | 0.12% |
| Health and Fitness | 22.50% | 2.85% | 0.37% |
| Hobbies | 28.85% | 5.43% | 0.22% |
| Home and Garden | 24.78% | 3.82% | 0.37% |
| Insurance | 20.27% | 2.12% | 0.23% |
| Legal | 22.73% | 2.97% | 0.22% |
| Manufacturing | 22.86% | 2.53% | 0.35% |
| Marketing and Advertising | 18.41% | 2.09% | 0.28% |
| Media and Publishing | 22.32% | 4.59% | 0.12% |
| Medical, Dental, and Healthcare | 22.69% | 2.53% | 0.29% |
| Mobile | 19.82% | 2.17% | 0.37% |
| Music and Musicians | 22.91% | 2.91% | 0.29% |
| Non-Profit | 25.26% | 2.84% | 0.19% |
| Other | 23.30% | 2.96% | 0.27% |
| Pharmaceuticals | 20.34% | 2.68% | 0.21% |
| Photo and Video | 26.63% | 4.01% | 0.39% |
| Politics | 22.96% | 2.35% | 0.21% |
| Professional Services | 20.94% | 2.68% | 0.30% |
| Public Relations | 20.02% | 1.67% | 0.22% |
| Real Estate | 21.66% | 2.02% | 0.32% |
| Recruitment and Staffing | 19.94% | 2.32% | 0.30% |
| Religion | 26.24% | 3.29% | 0.12% |
| Restaurant | 21.92% | 1.24% | 0.28% |
| Restaurant and Venue | 22.17% | 1.40% | 0.40% |
| Retail | 21.55% | 2.66% | 0.28% |
| Social Networks and Online Communities | 21.85% | 3.50% | 0.23% |
| Software and Web App | 21.55% | 2.44% | 0.39% |
| Sports | 25.89% | 3.54% | 0.27% |
| Telecommunications | 21.42% | 2.50% | 0.28% |
| Travel and Transportation | 20.68% | 2.31% | 0.24% |
| Vitamin Supplements | 17.45% | 2.05% | 0.27% |
![]()
© 2021 Lead Liaison, LLC. All rights reserved.
13101 Preston Road Ste 110 – 159 Dallas, TX 75240 | T 888.895.3237 | F 630.566.8107 www.leadliaison.com | Privacy Policy