Overview
The Events Dashboard displays metrics from your events. From here, you can view the number of submissions, data on how the Prospects were captured, and even view an ROI.
Viewing the Dashboard
To view the Events Dashboard,
- Click the Dashboard tab in the main menu.
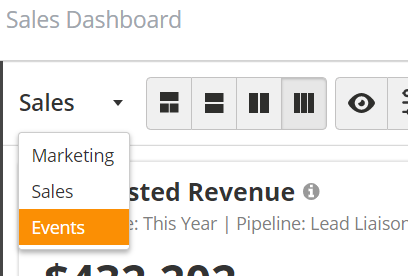
- If necessary, select Events in the drop-down menu in the top-left corner of the screen.
- Select filters.

The default filter is for the Last 7 Days. You can also filter by Event Name, the Event Owner, a time frame, or an Event Label. If you filter by Event Name, you won't see options for Owner, time, or Label.
Summary Bar
Use the Summary Bar at the top of the Dashboard to get a quick overview of your event.
| Report | Explanation | Notes |
|---|---|---|
| Submissions | Total number of unique submissions | Includes duplicates if duplicates are enabled on your Event Form |
| Prospects Collected | Number of unique Prospects | Unique identifier is email address |
| Quality (Grade) | Average Grade of all Prospects | Learn more about grading here |
| Engagement (Score) | Average Engagement Score of all Prospects | Learn more about scoring here |
Pending | Submissions awaiting transcription or post-show reconciliation | Failed badge scans will also appear in this number |
| Related Prospects* | Lets you view any Related Prospects that have been fetched during submission action | Only available with Sales Enablement license |
| Leads per Event | Average number of unique Prospects captured in selected Filter | |
| Cost Per Lead* | Cost of show divided by number of Prospects | |
| Revenue* | Revenue from Closed-Won Deals associated with the Event's Campaign | Only available with OneFocus™ CRM or a Salesforce.com integration |
| ROI* | Return or loss percentage using revenue from Closed-Win Deals associated with the Event's Campaign | Only available with OneFocus™ CRM or a Salesforce.com integration |
*Only available when an individual Event is selected.
In order to calculate Cost Per Lead and ROI, your Event must be in a Lead Liaison Campaign. The system will use the cost you put in the Campaign.
Reports
View the table below for a summary of dashboard reports available.
| Report | Explanation | Notes |
|---|---|---|
| Hot Prospects | Prospects who show recent engagement with your content (clicked an email, downloaded content, etc.) and meet basic qualification rules | Learn more about Hot Prospects here |
| Top 5 Device Users | Users who captured the most Prospects but total submissions | Click numbers to view Prospects |
| Prospects Collected | Number of Prospects captured by date | Click numbers to view Prospects |
| Capture Methode | How the user captured the Prospect (badge scan, business card, manual entry, or List) | Click numbers to view Prospects |
| Transcriptions | Number of transcriptions (both internal and external) done by date | Also displays average turnaround time; click the info icon to see individual submission turnaround times. |
| Post Event Engagement | Percentage of Prospects who show inbound activity after the event (opened email, downloaded content, etc.) | Click numbers to view Prospects |
| Pending Submissions | Number of incomplete transcriptions by original submission date | Use the toggles to turn on/off different pending submission types |
| Converted Registrants | Number of Prospects on a List connected to your Event that were scanned in during the Event | Click numbers to view Prospects |
| Top Companies | Companies with the highest number of submissions | Click numbers to view Prospects |