...
Understanding Interaction Results
In the Marketing Section
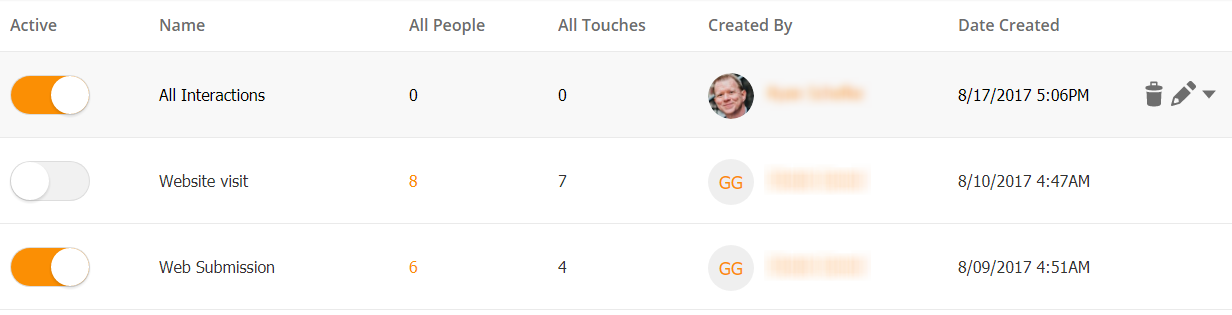
When navigating to Marketing > Interactions you'll see a table with multiple columns. Each column is explained below:
- Active: Enables the Interaction.
- Name: Name of the Interaction.
- All People: All Known (anyone with an email) and Anonymous Prospects (anyone without an email) who have met your Interaction criteria (demonstrated one of the enabled Inbound Activities).
- All Touches: A count of the number of Inbound Activities enabled by the Interaction. For example, suppose an Interaction has these four (4) Inbound Activities: Website Visit, Landing Page Visit, Web Form Submission and Content Download. If the Prospect makes a website visit, views a landing page and downloads a content piece (three (3) Inbound Activities), then this will count as:
1 in the All People column
3 in the All Touches column
- Created By: Lead Liaison user who created the Interaction.
- Date Created: Date the Interaction was created.
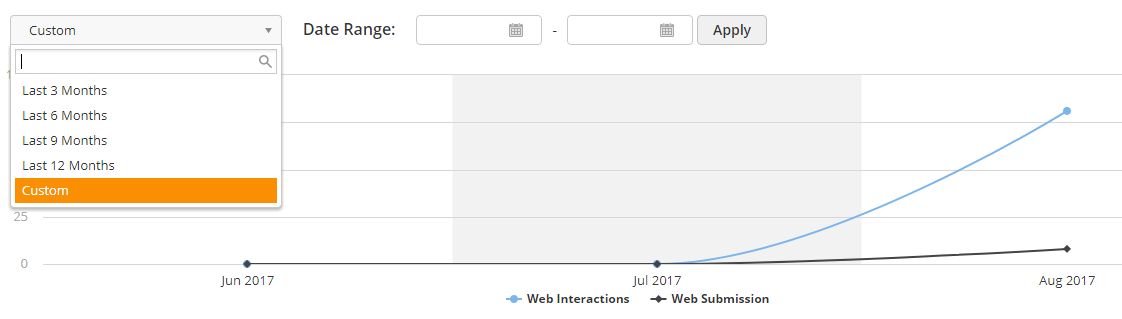
Above the table a graph will be displayed. To view Interactions over time, choose a standard period from the dropdown on the top left, or select a custom time period as shown below.
In the Dashboard
Interactions are also displayed in the Dashboard. To access the Interactions widget in the Dashboard, do the following:
- Navigate to Dashboard
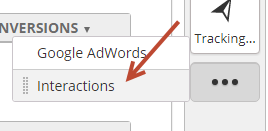
- Drag and drop the Interactions widget from the right panel. If you don't see the widget, then click the three dots and select Interactions as shown below.
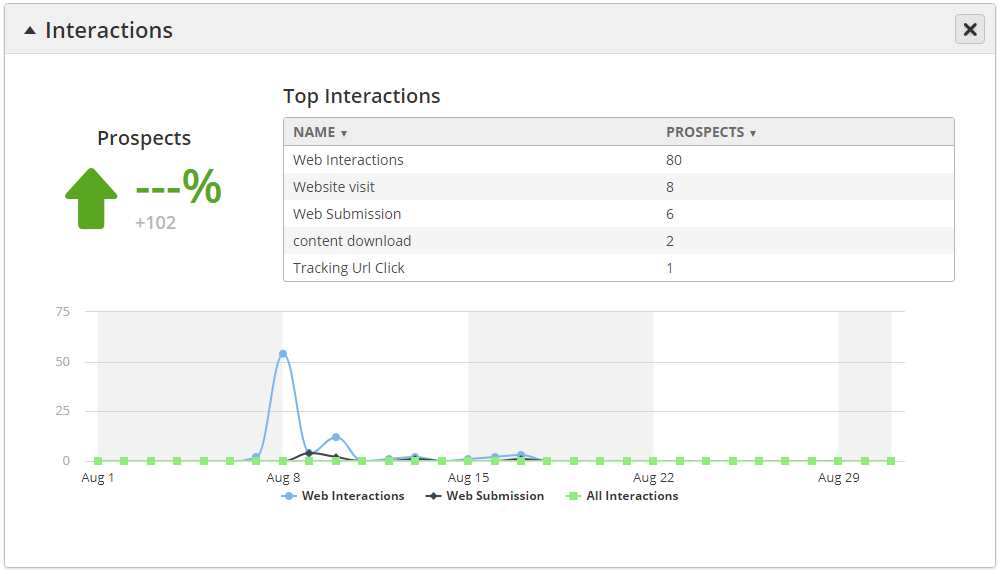
- The widget shows the top five (5) Interactions, based on number of Prospects who have met your Interaction criteria.
- Use the Dashboard comparison capabilities to compare how your Interactions are performing relative to other months. To learn more about the Dashboard read this page.
Triggering Automation from an Interaction
...