...
...
...
...
...
...
...
...
| Info | ||
|---|---|---|
| ||
Access to this report is available upon request. Please contact your Lead Liaison Representative to have this report added to your account. |
| Table of Contents |
|---|
Location
Shared Reports > Revenue Analysis > Lifecycle Stage Analysis
Overview
Helps analyze trends/patterns prior to form submissions.
...
Within each report, select or deselect Lifecycle Stages to analyze using the panel on the left.
Analytics
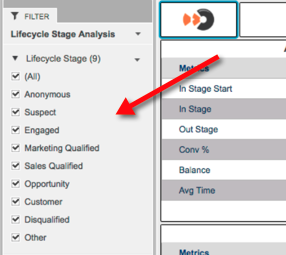
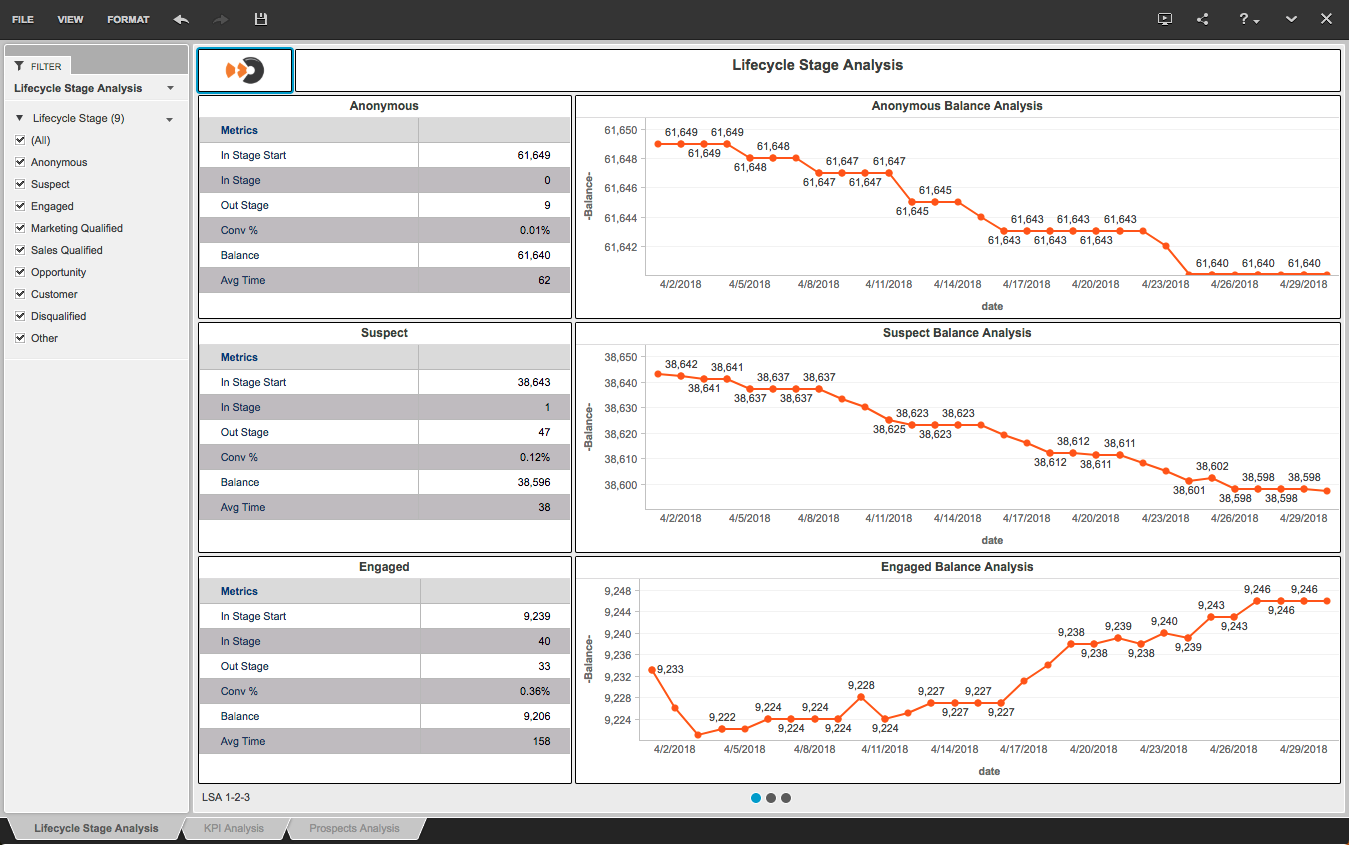
Lifecycle Stage Analysis
Provides an in depth analysis of your Lifecycle Stages over the reported period. Definitions for data reported in each Lifecycle Stage are below:
- In Flow Stage Start: Number of Prospects that were in this Stage on the Baseline Date.
- In Flow Stage: Number of Prospects that entered this Stage during the Start and End Date.
- Out Flow Stage: Number of Prospects that left this Stage during the Start and End Date.
- Conv %: Number of Prospects that left this Stage compared to how many Prospects were in the Stage to start (# of Out Flow Stage / # In Flow Stage Start). Helps you identify which Stages are converting faster than others.
- Balance: Number of people that were in the Stage on the Start Date, and also in the stage on the End Date. Helps you understand which Stage Prospects are getting "stuck" in (In Flow Stage - Out FlowStage).
- Avg Time: Average time a Prospect was in the Stage. Analyzes only Prospects that have left the stage during the time frame.
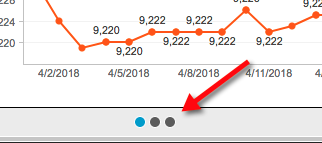
Make sure to click on each dot at the bottom of the report to view all Lifecycle Stages.

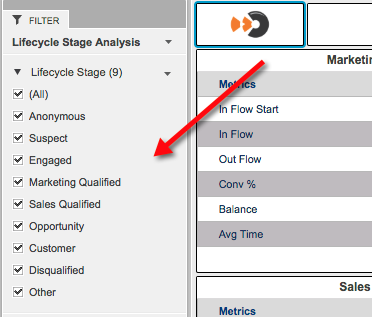
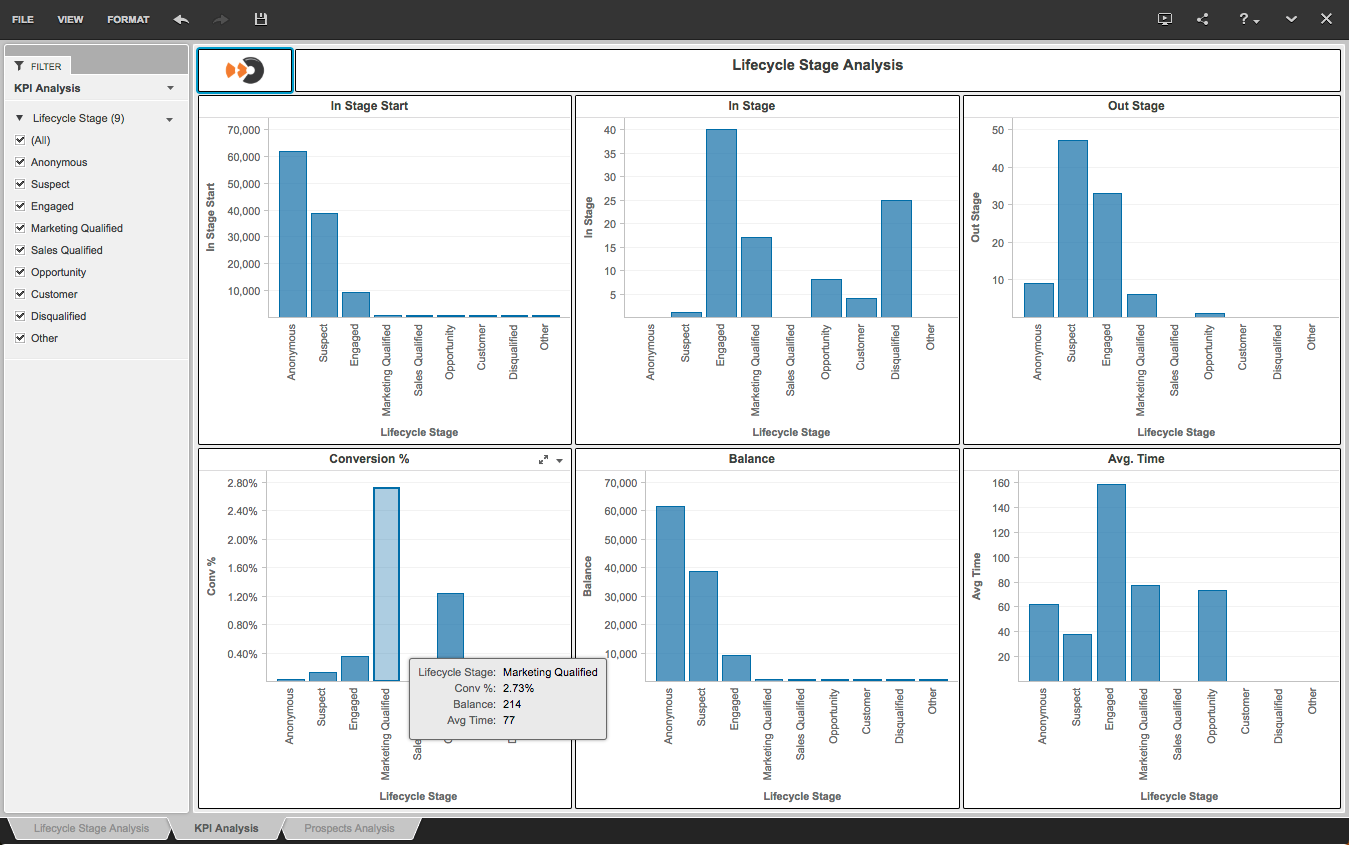
KPI Analysis
Groups each metric across all Lifecycle Stages. This view provides a holistic representation of each data point to help make decisions on which Lifecycle Stages need more focus/attention. For example, looking at the Conversion % box on the bottom left tells us we're converting 2.73% of our Marketing Qualified leads during the given time period. That's much higher than the other Lifecycle Stages during the same period.

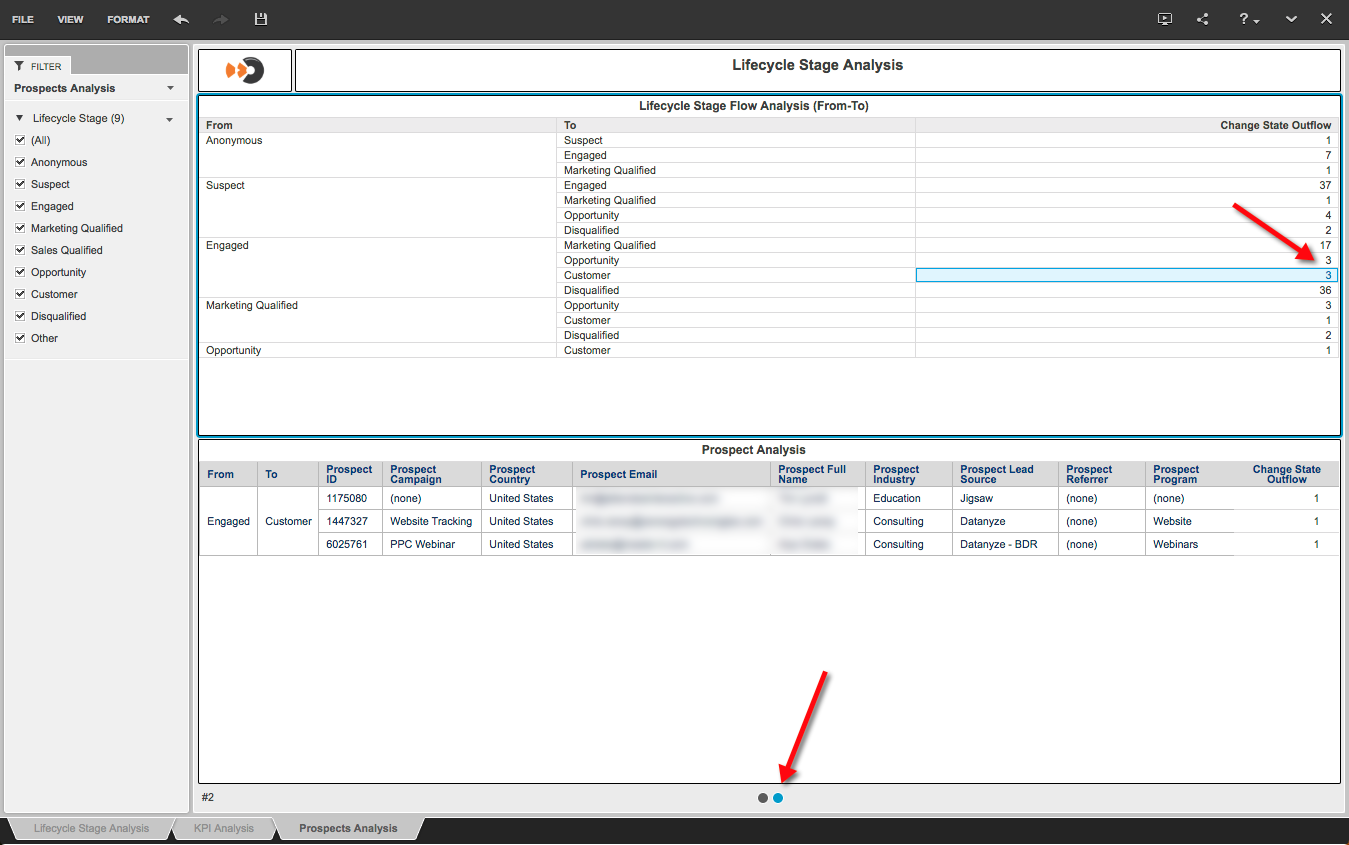
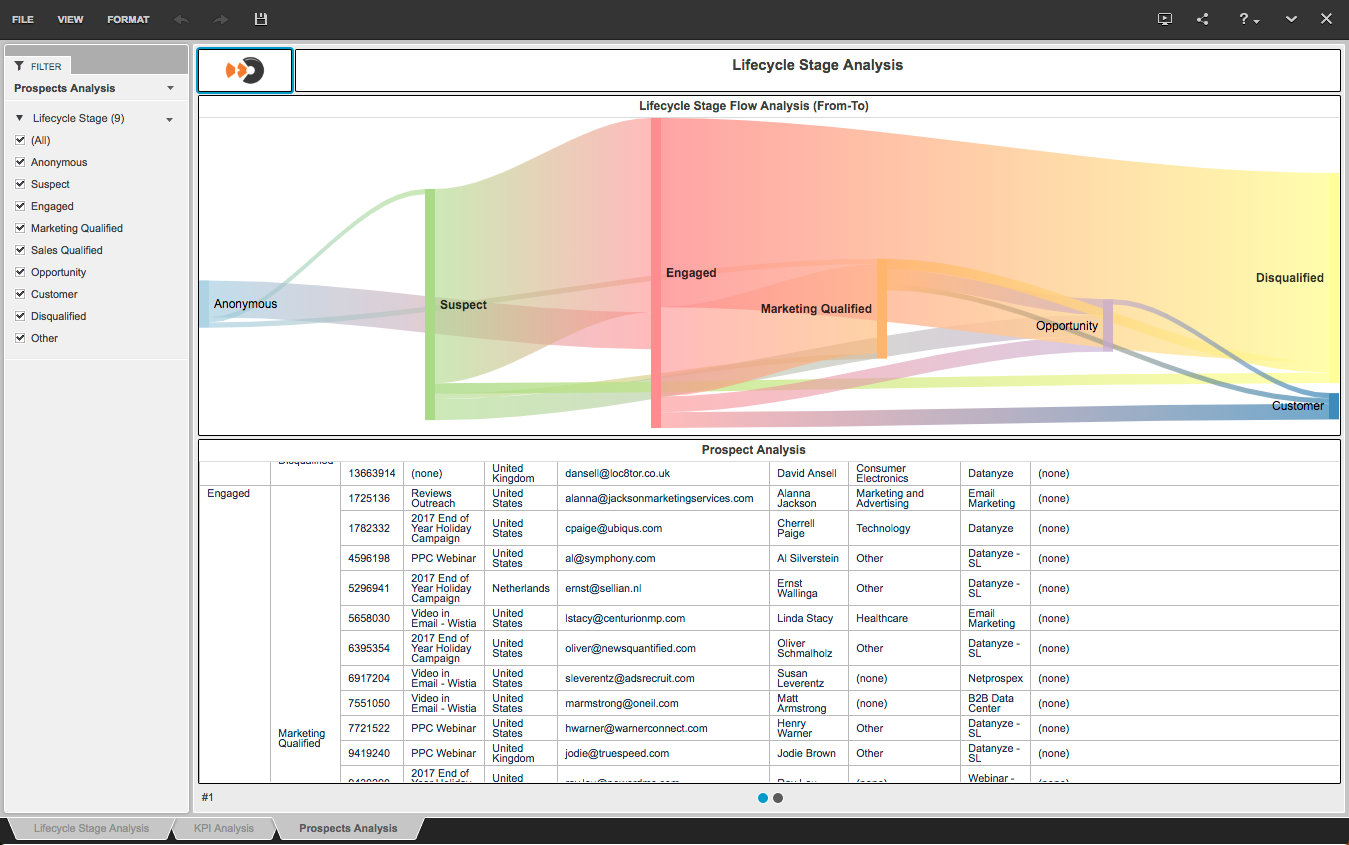
Prospect Analysis
Analyzes the flow of Prospects through each Lifecycle Stage during the reported period.

Click on the bar before any Lifecycle Stage to analyze the Prospects flowing into that Stage during the reported period. In the screenshot below, the red arrow shows the vertical bar to click on. In this case, we're showing the Prospects (one of them) that flowed from the Opportunity Lifecycle Stage into the Customer Lifecycle Stage during the reported period.

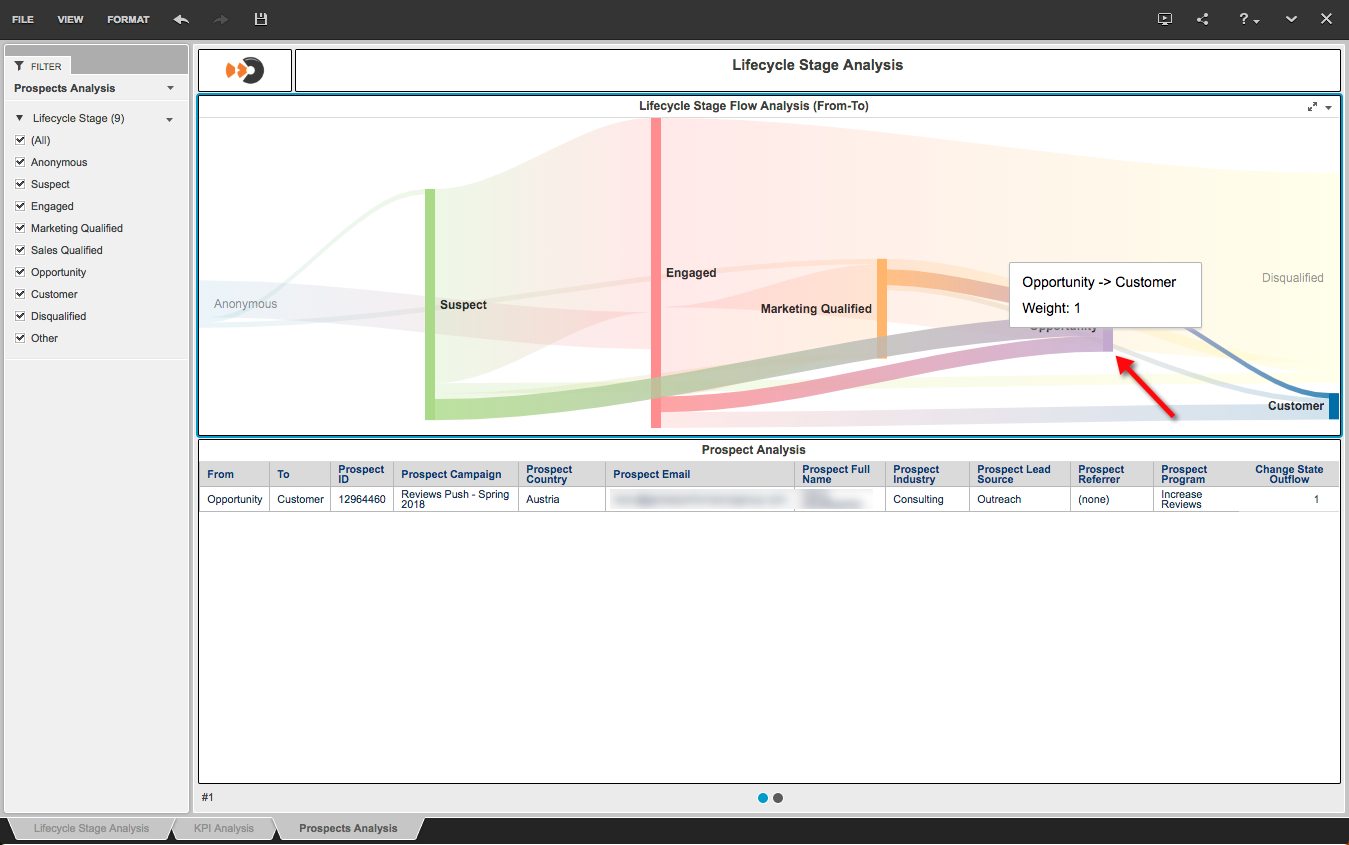
Select the next panel on the Prospects Analysis tab to click through on the number to the right. In the example below, we can see the number of Engaged Prospects who were converted to Customers (three) during the reported period along with the results below. Click the down arrow on the results to export data as needed.