...
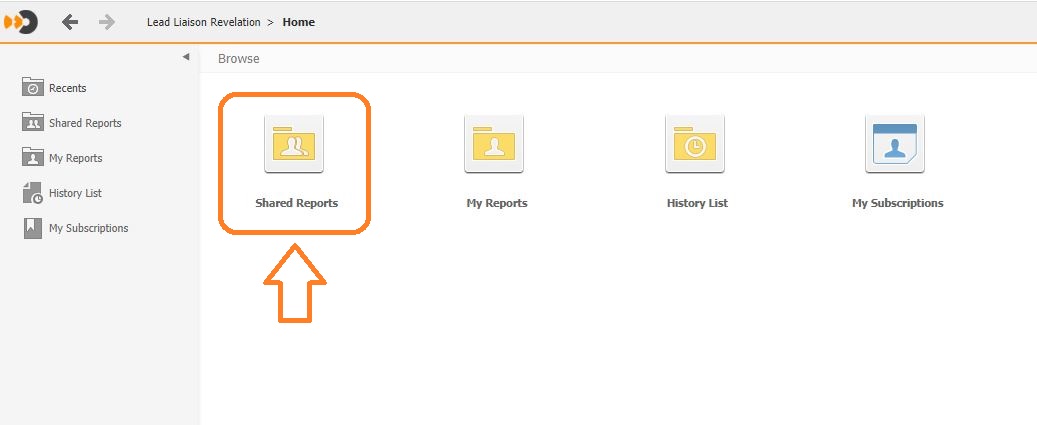
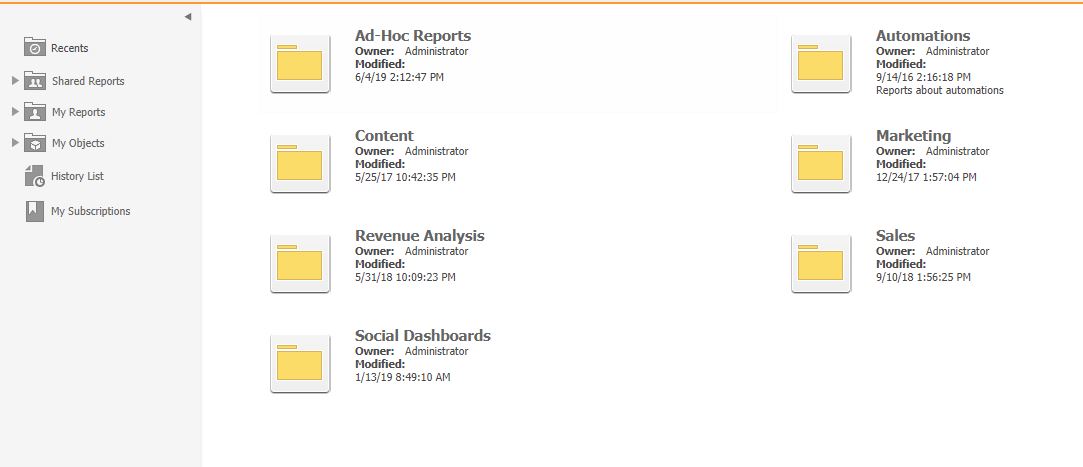
Revelation reports comprise of the following main sections that are available under the Shared Reports folder:
| Table of Contents |
|---|
Content
Web Forms
This section covers details about the data collected via your web forms. You can view captured data as well as analyze trends/patterns prior to form submissions. Supporting tables, graphs and charts are included.
...
An overview of each report along with supporting screenshots is available here.
Email Marketing
This section provides complete performance statistics of your various email campaigns. This helps you identify how good or bad a certain email campaign has performed in terms of key metrics such as Open rate, Click rate, Bounce rate etc. as well as overall engagement.
...
An overview of each report along with supporting screenshots is available here.
Website
This section covers information about your website visitors and the performance of your various web pages in terms of visitors and engagements. This helps you understand where your visitors are coming from, what pages are they visiting on your website, how much time they’re spending on your website and what sort of content are they interacting with.
...
An overview of each report along with supporting screenshots is available here.
Revenue Analysis
Lifecycle Stage Analysis
This section provides information about the prospects in different lifecycle stages and covers data about conversion rate, balance, avg. time spent in a stage etc. This helps analyze trends/patterns prior to form submissions.
...
In Stage Start: Number of Prospects that were in this Stage on the Baseline Date.
In Stage: Number of Prospects that entered this Stage during the Start and End Date.
Out Stage: Number of Prospects that left this Stage during the Start and End Date.
Conv %: Number of Prospects that left this Stage compared to how many Prospects were in the Stage to start (# of Out Stage / # In Stage Start). Helps you identify which Stages are converting faster than others.
Balance: Number of people that were in the Stage on the Start Date, and also in the stage on the End Date. Helps you understand which Stage Prospects are getting "stuck" in (In Stage - Out Stage).
Avg Time: Average time a Prospect was in the Stage. Analyzes only Prospects that have left the stage during the time frame.
KPI Analysis
Groups each metric across all Lifecycle Stages. This view provides a holistic representation of each data point to help make decisions on which Lifecycle Stages need more focus/attention. For example, looking at the Conversion % box on the bottom left tells us we're converting 2.73% of our Marketing Qualified leads during the given time period. That's much higher than the other Lifecycle Stages during the same period.
...
Prospect Analysis
Analyzes the flow of Prospects through each Lifecycle Stage during the reported period.
...
An overview of this report along with supporting screenshots is available here.
Marketing
Demand Generation
This section provides information on your newly created Prospects who have a Lead Source, Campaign, and Program field. This helps you understand how the company is doing in terms of creating new Prospects from various different Lead Sources, Campaigns, and Programs. This is specially useful for your marketing team as it helps them decide which marketing campaigns should be focused on and which ones should be terminated.
...
An overview of each report along with supporting screenshots is available here.
Ad-hoc
This section covers the following reports:
...
An overview of each report along with supporting screenshots is available here.
Automations
This section provides information about the performance of your automation in terms of no. of prospects as well as the no. of days it takes to achieve a particular target score. Lead Liaison offers lead scoring to help qualify leads based on their interests and activities. Prospects are scored according to specific activities that indicate interest in a certain solution. Scoring values are represented by a number, ranging from 0 to 1,000.
...
An overview of each report along with supporting screenshots is available here.
Sales
ABM
This section provides information on the performance of your sales and marketing activities. The data provided in these reports helps you understand:
...
An overview of each report along with supporting screenshots is available here.
Trip Planner
The reports available in this section and specially useful for any executive or sales person trying to plan a trip to meet with existing or potential clients. Using the data provided, you can see prospects and/or customers in the area to plan the trip and make it efficient.
...
An overview of each report along with supporting screenshots is available here.
Social Dashboards
As the name indicates, this section provides data to help you do a demographic and social analysis of the organizations and visitors engaged through your social media channels.
...