...
- Pie Chart: percentage of response vs. no response for text-entry fields.
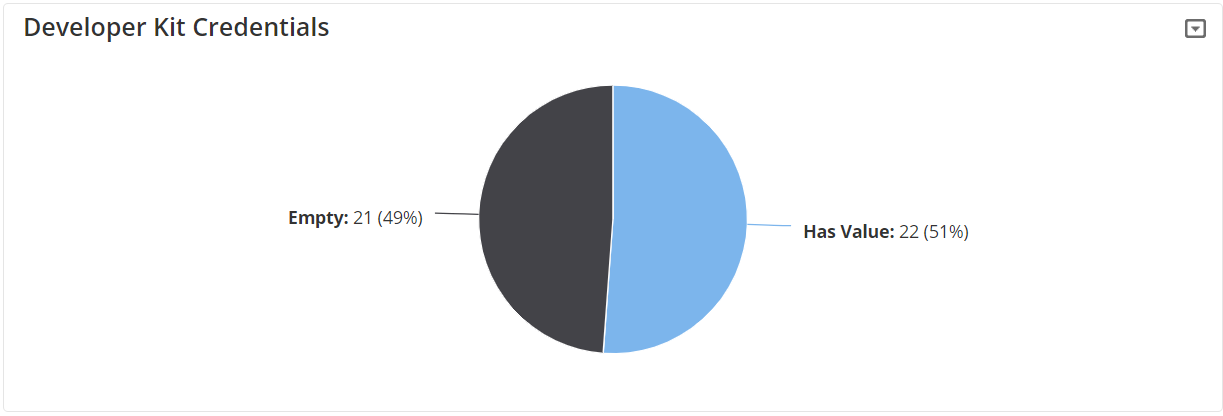
When viewing a report, you can click on any wedge/bar to see the Prospects representedProspects represented. For example, if you clicked on the Has Value wedge in the screenshot above, you would see a list of all 22 Prospects.
| Info |
|---|
The Prospect List only shows unique Prospects, but the reports show total survey results. If there are duplicate submissions, the number of responses in the reports will not match the number of Prospects in the List. |
...